2025 Washington Mystics
Team Performance
Dashboard
Problem
Raw WNBA game logs are often dense and difficult to analyze mid-season, making it hard to spot performance trends quickly.
Solution
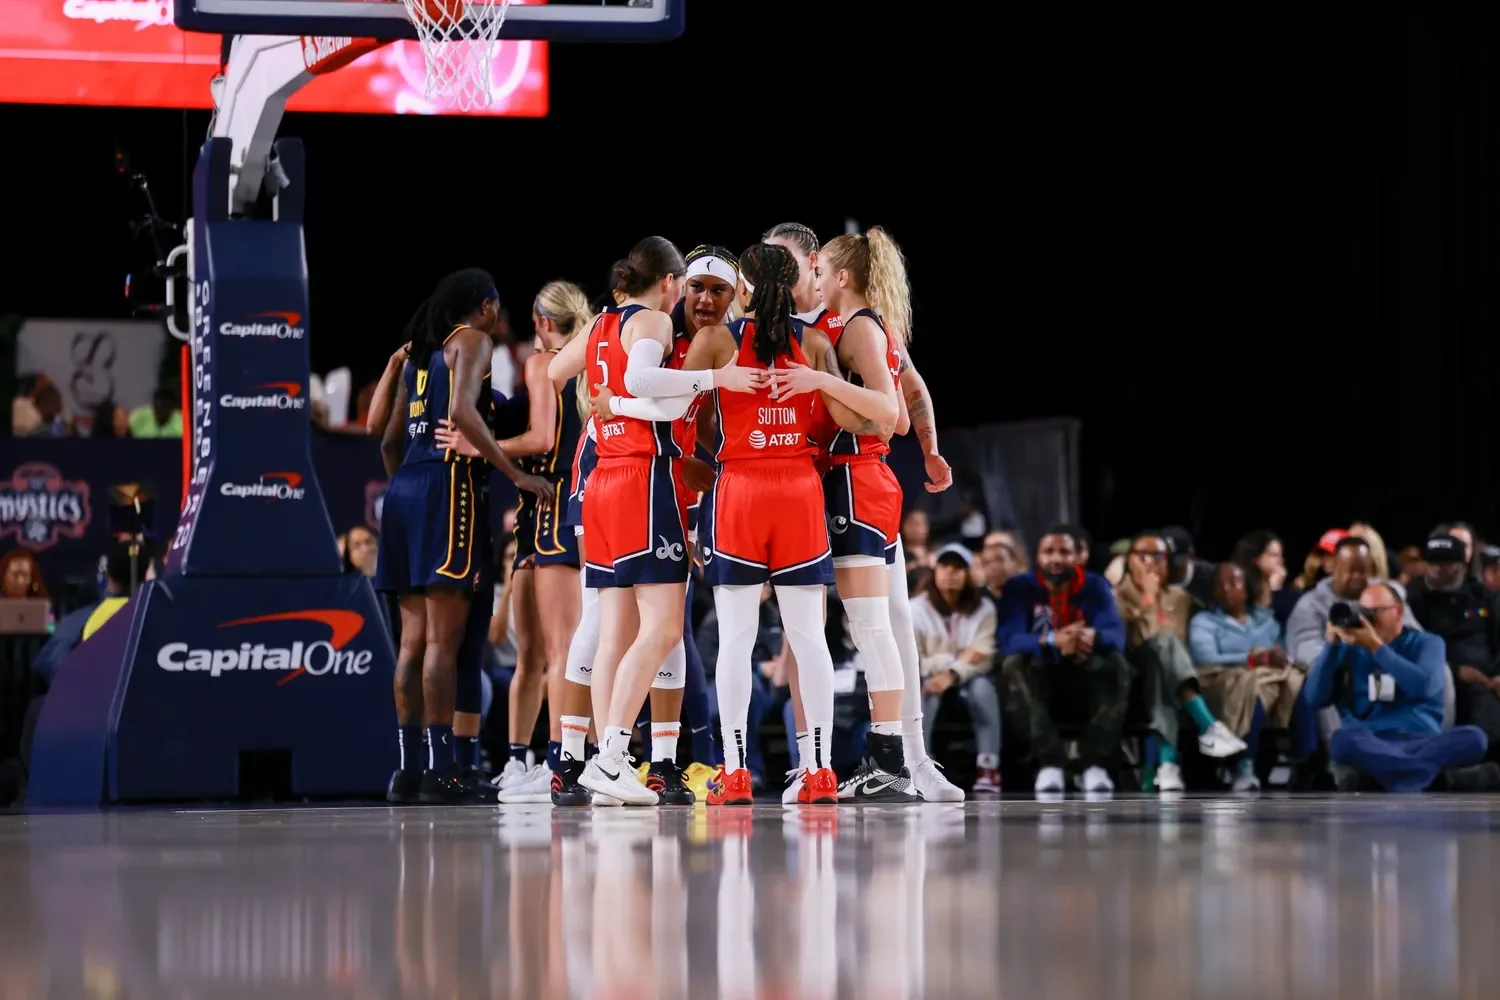
I built an interactive performance dashboard to centralize 2025 Washington Mystics stats, helping users visualize team strengths and player contributions through key performance indicators (KPIs).
Technical Implementation
Data Architecture (Excel)
Cleaning up Data: I used Excel to scrub raw WNBA game logs, ensuring consistent naming conventions for players and removing duplicate entries to maintain data integrity.
Data Integrity: To avoid common name errors, I used Unique Player IDs as primary keys, ensuring that trade-related data or similar names didn't skew the results.
Standardization: I standardized date formats and team labels so the dashboard could filter across the entire 44-game season without errors.
Visual Storytelling (Tableau)
Interactive Filtering: I implemented filters for Wins/Losses and Player Data, allowing a coach to see how the team performed and how specific players impacted each game.
KPI Scorecards: I placed "Big Number" cards at the top for Points Per Game (77.1) and Win Percentage (.364) to provide an instant health-check of the team's 2025 season.
Accessibility in Design: Instead of standard red/green scales, I used high-contrast brand colors to ensure the data storytelling was accessible and followed modern visualization conventions.
Key Insights
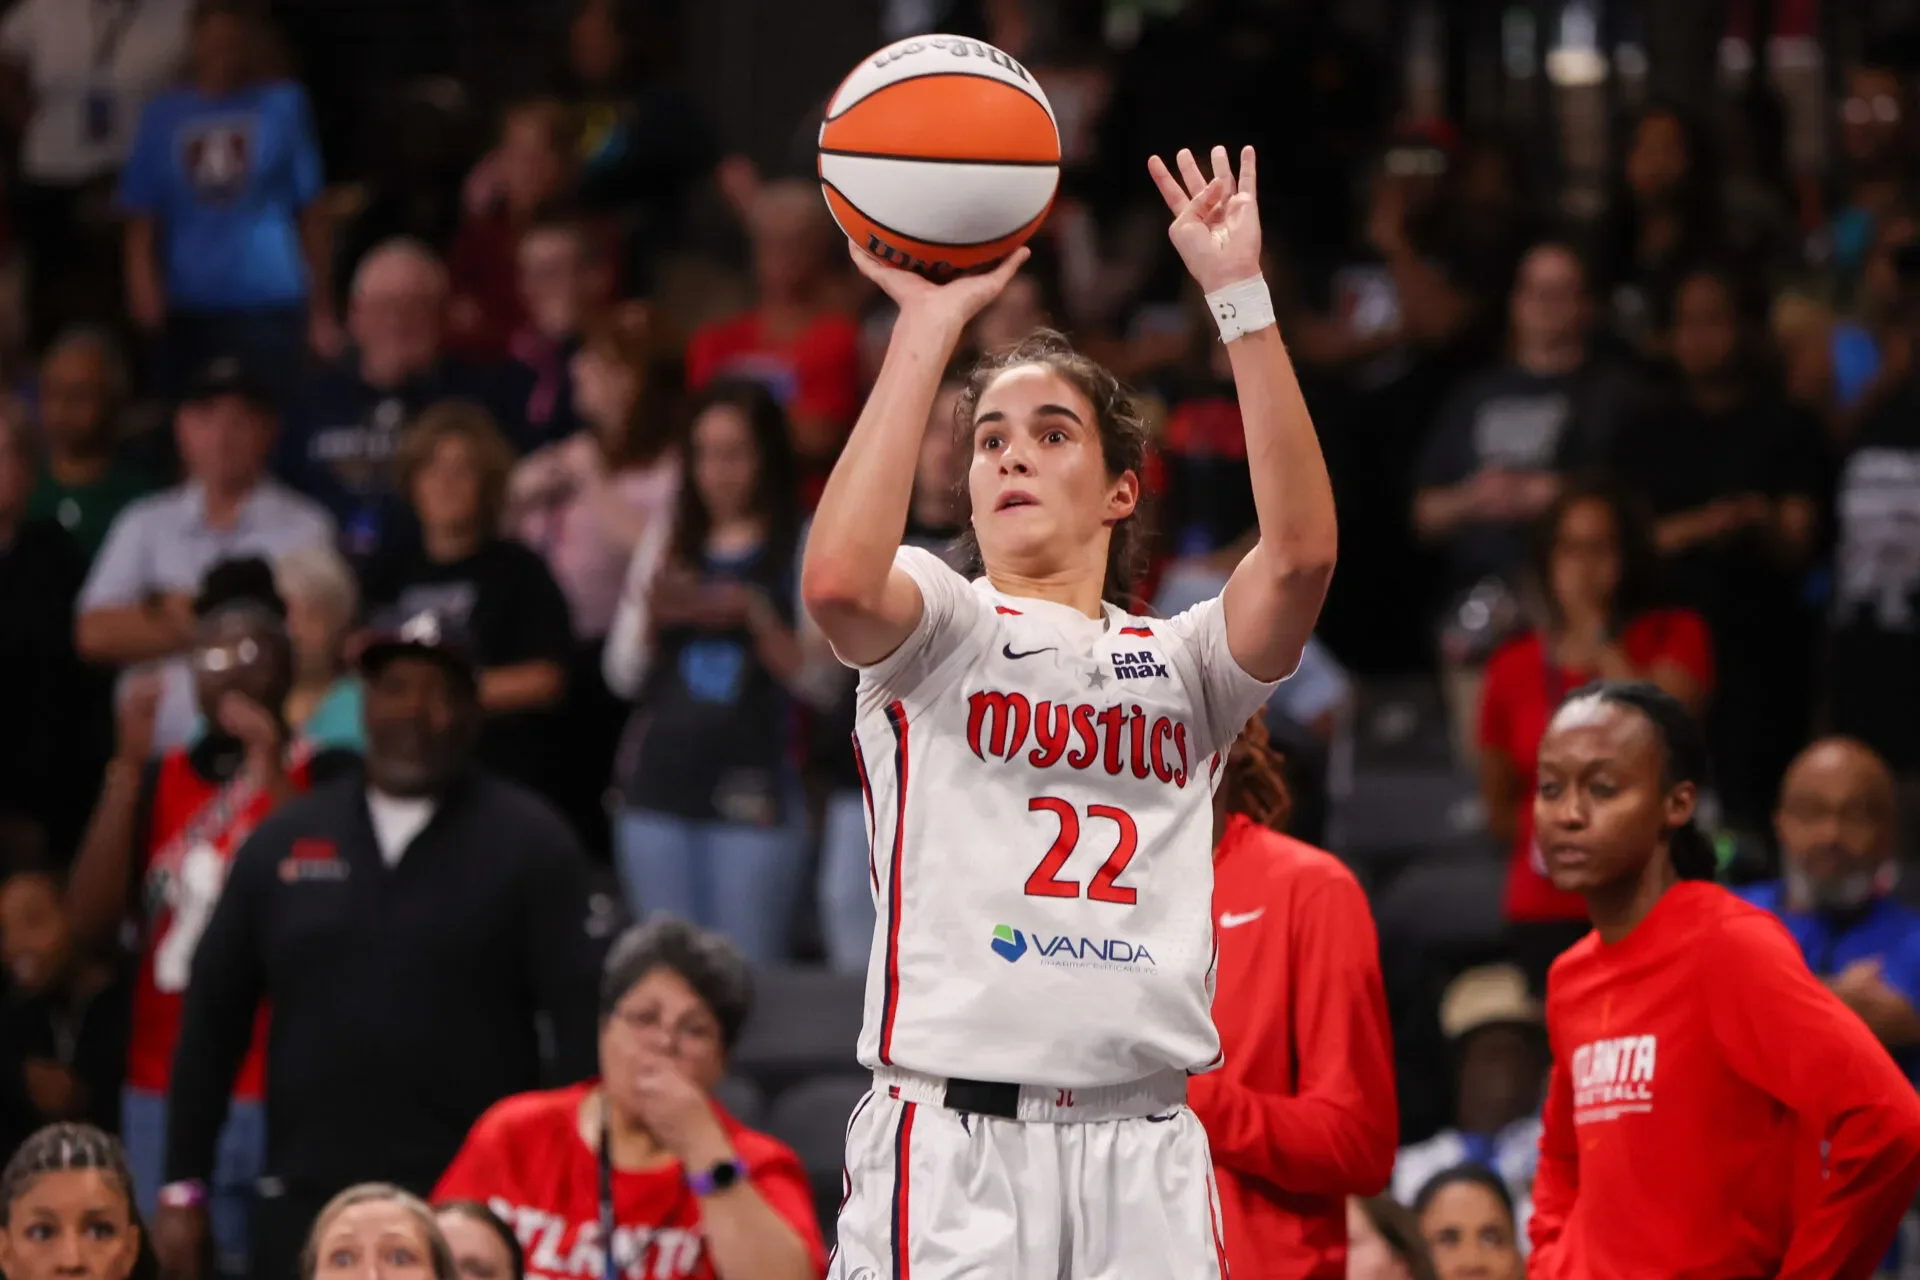
Breakout Performance: The dashboard clearly identified Sonia Citron as the team's offensive engine, leading the Mystics with 14.9 PPG and a team-high 109.9 Offensive Rating.
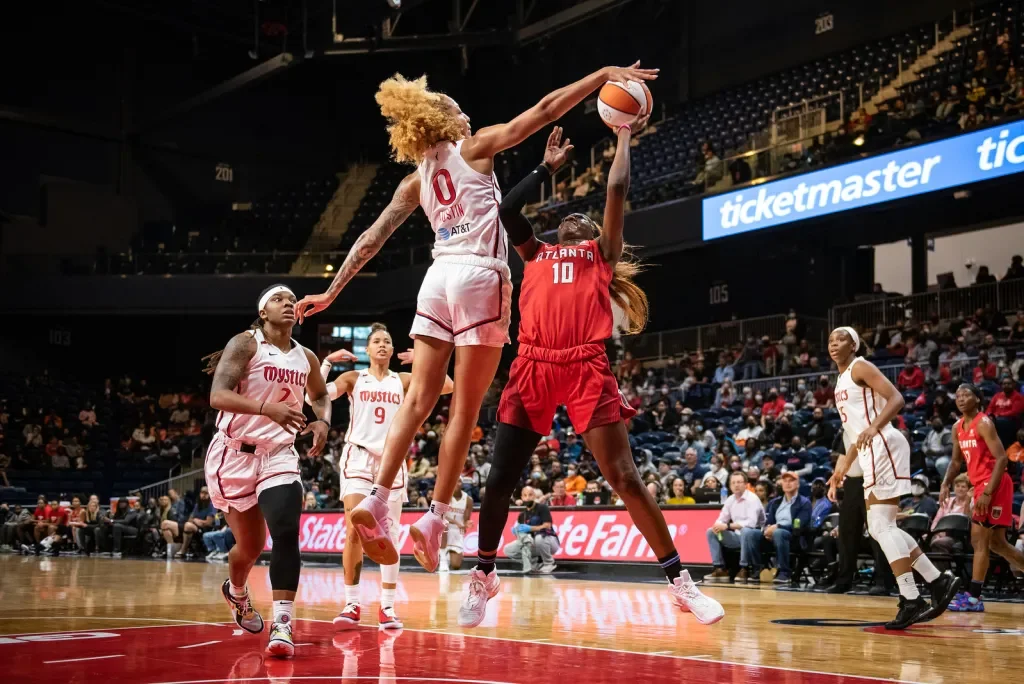
Defensive Anchors: Visualizing the blocks and steals data highlighted Shakira Austin (43 blocks) and Sonia Citron (55 steals) as the primary defensive impact players.